
Halcyon Agri’s Take on the World’s Natural Rubber Situation
Background
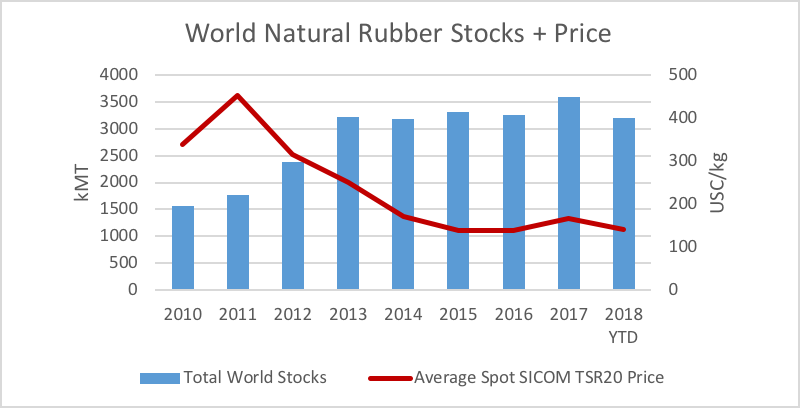
There has been a steady decline in natural rubber prices since 2011 due to rising stocks as a result of expanding production. Prices are declining to an unsustainable level for key stakeholders in the industry driving potential future supply-side implications. Persistent increase in China’s visible inventory driving large market imbalances are contributing to the negative market sentiment.
This paper provides a further analysis and a breakdown of the world’s natural rubber situation and China’s usable stocks.
World Situation Overview
With reference to IRSG data, absolute stocks of natural rubber have been increasing steadily since 2011 (Figure 1). This obviously coincides with a decline in average natural rubber prices over the same period.
Figure 1: World Natural Rubber Stocks and Price
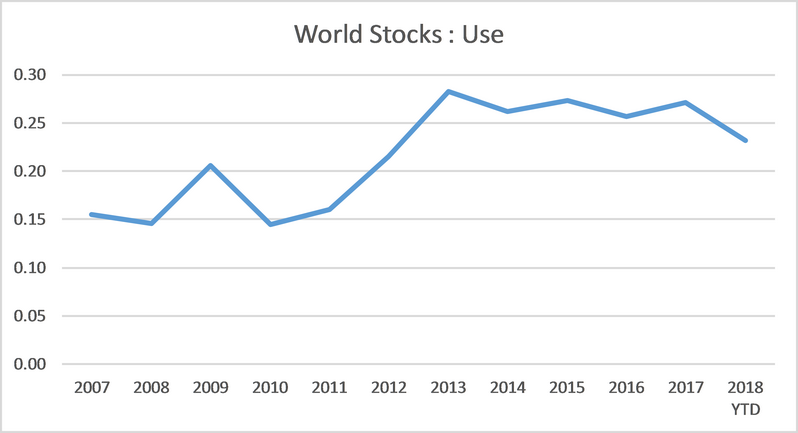
As absolute stocks have been increasing, it is important to look at the overall market situation in terms of stocks-to-use. Figure 2 shows a peak in stocks-to-use in 2013, and since then a slight decline.
Figure 2: World Stocks-To-Use Ratio
Further analysis is required for a more detailed picture of the natural rubber market. It is important now to look further into where these stocks are sitting geographically and within the value/supply chain. Firstly, we break down the total stocks into China and the Rest of World.
China Stocks
China stocks can be broken down into five main categories (Table 1).
Table 1: China Stocks
| Location | Grades | Source | Comments | Tradability |
| 1. SHFE Warehouse | SCR WF and RSS | Exchange published and transparent | Two-year-old production not re-tenderable | Tradable in theory, large volumes tied up in exchange delivery /cash and carry play |
| 2. Qingdao Bonded Zone | NR, Mixture, SR | Published by QD Int’l Rubber Exchange and transparent | Reliable historical source | Freely tradeable and accessible |
| 3. Qingdao Non-Bonded | Mixture | Not published | Private estimates via survey, limited history | Freely tradeable and accessible |
| 4. Commercial | All imported and domestic | Not published | Includes end user, producer and traders inventory | Freely tradeable and accessible |
| 5. State Reserve Bureau | SCR WF and RSS | Not published | Estimated based on SRB purchasing since 2009 | Not tradable or accessible |
Sources: SHFE, Qingdao International Rubber Exchange, Halcyon Agri’s analysis
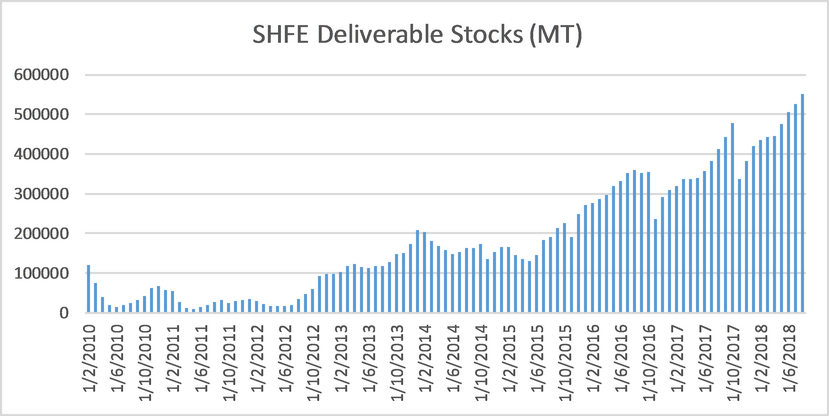
1. SHFE Stocks (Figure 3)
It is well known these stocks have been steadily increasing over the years due to the positive SCR WF delivery margin, and wide carry driven by the two-year age limit on exchange warehouse receipts.
The exchange rules state that inventory must not be more than two years old and expiring inventory receipts must be retendered into the following year, which is why there is a sharp drop each November.
The predominant grade in the system is SCR WF, which is of a higher quality latex grade. Imported RSS from select origins is also deliverable to SHFE.
Of the current 566kmT currently in SHFE warehouses, only 100kmT is RSS, and the balance is SCR WF. Of the total 566kmT, over 300kmT will be expiring this November.
It is estimated that the real consumer demand for SCR WF is only 150kmT per year, compared to the total consumption of over 6mmT, so SCR WF represents only 2.5% of the China natural rubber market.
For SCR WF to increase its share of consumption and buy more demand, it must price below imported mixture and other locally produced grades, but even then its incorporation is limited. For this reason, at current prices, we see limited scope for SCR WF to materially displace and compete with more widely produced imported TSR20, mixture or local SCR grades.
Figure 3: SHFE Deliverable Stocks (MT)
2. Qingdao Bonded Zone Stocks
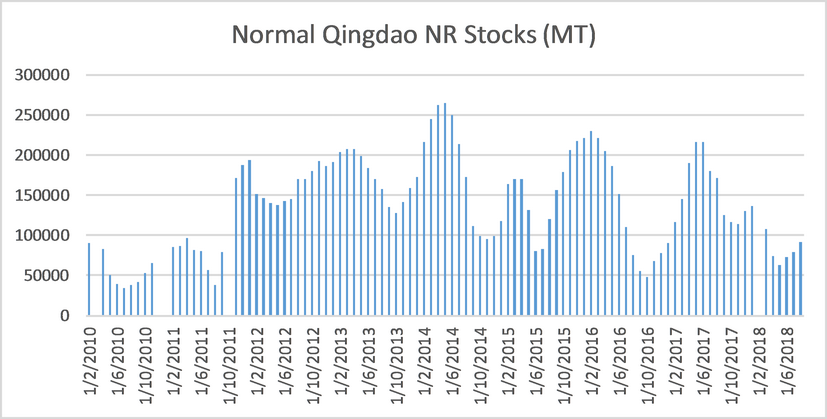
This stock data is recorded in three categories, Normal Natural Rubber (Figure 4), Compound Rubber (largely obsolete) and Synthetic (includes Mixture Rubber – approx. 70% of total), which are all imported.
Normal NR attracts the 1500RMB/mT import duty once cleared. The stock level has fluctuated between 50-250kmT since 2015 and is currently at the lower end of the range.
Figure 4: Normal Qingdao NR Stocks (MT)
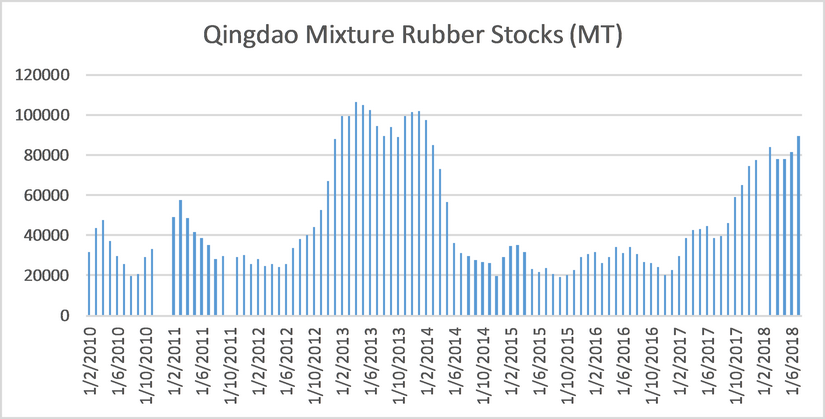
Historical Compound Rubber and Synthetic Rubber (70%) stocks (Figure 5) have been combined for simplicity from 2015 onwards as Compound Rubber is replaced by Mixture Rubber, which is captured in the SR stock number. Will refer to these as QD bonded zone Mixture stocks.
Mixture rubber now represents the largest share of China’s total rubber imports and attract zero import duty. These stocks as held in a relatively tight range of 20-100kmt.
Figure 5: Qingdao Mixture Rubber Stocks (MT)
3. Qingdao Non-Bonded Zone Stocks – Mixture
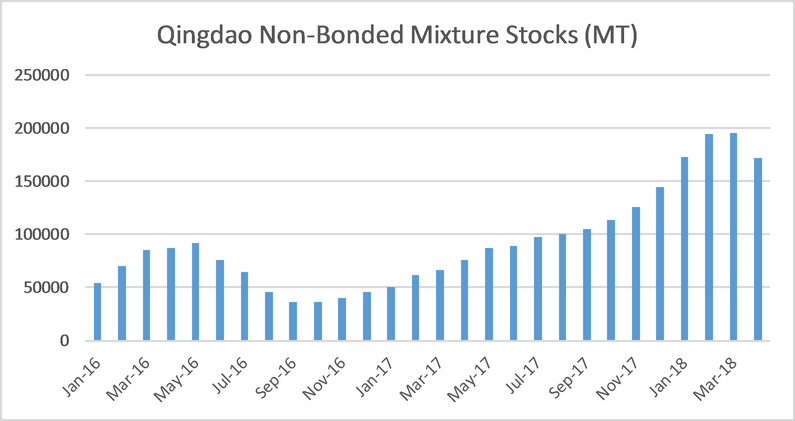
Mixture rubber, once customs cleared will end up being held outside of the bonded zone where it can then be traded in RMB.
There is no official reported data for these stocks and limited historical data is available and analyse in-house. These stocks have been steadily increasing over the past 18 months. Unfortunately, we only have data from 2016 (Figure 6).
Figure 6: Qingdao Non-Bonded Mixture Stocks (MT)
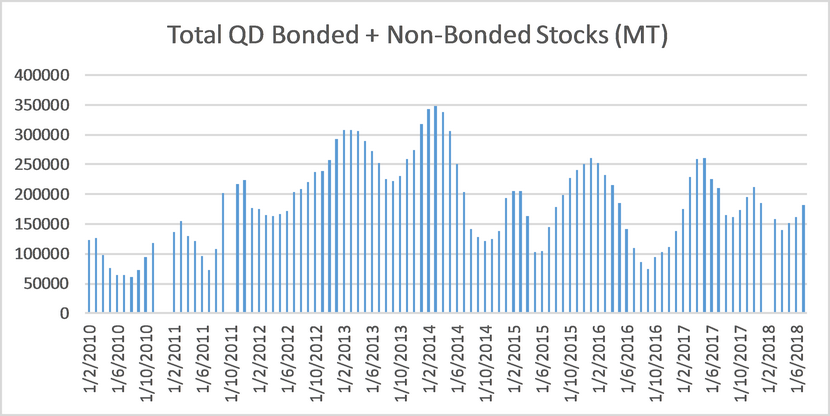
For further analysis, we combine both Qingdao bonded and non-bonded stocks to have a better complete picture (Figure 7). Again, total combined stocks are at lower to the middle level of the historical range.
It is clear that these combined stocks are not burdensome and a large part of this inventory is held as a cash and carry play against SHFE.
Figure 7: Total Qingdao Bonded + Non-Bonded Stocks (MT)
4. Commercial Stocks
These include rubber held by processors in Hainan and Yunnan of local production, the material in the hands of tyre manufactures and other end uses, as well as traders.
There is no official data for this, hence an in-house estimate is used.
5. State Reserve Bureau Stocks
SRB stocks are not freely tradable and should be excluded from any supply and demand analysis. There is no indication of a reserve release particularly given the high price these were purchased. Also, these reserves are strategic, so it is more likely they will be rotated rather than released outright and therefore have no net impact on the market. Estimates put the SRB stocks at 550kmT split between SCR WF and RSS, with the exact quality breakdown not known.
Table 2 shows the annual summary of the China stock situation. The less freely traded or available stocks (SHFE SCR WF and SRB) are the categories that have increased the most and combined account for 60% of China’s total. Commercial stocks have grown in line with expanding demand with Qingdao Bonded and Non-Bonded fluctuating over the years.
Table 2: China Stock Summary (kMT)
| China Stock Summary (kMT) | |||||
| 年份 | SHFE WF | QD Bonded + Non Bonded | Commercial Stocks | SRB | Total China Stocks |
| 2010 | 62 | 58 | 362 | 210 | 692 |
| 2011 | 33 | 66 | 364 | 210 | 673 |
| 2012 | 98 | 209 | 389 | 270 | 966 |
| 2013 | 174 | 248 | 427 | 514 | 1363 |
| 2014 | 154 | 202 | 480 | 642 | 1479 |
| 2015 | 249 | 142 | 468 | 642 | 1501 |
| 2016 | 292 | 106 | 498 | 642 | 1538 |
| 2017 | 383 | 211 | 530 | 642 | 1767 |
| 2018 YTD | 551 | 178 | 543 | 642 | 1914 |
Stocks-to-use Analysis – Rest of World Stocks
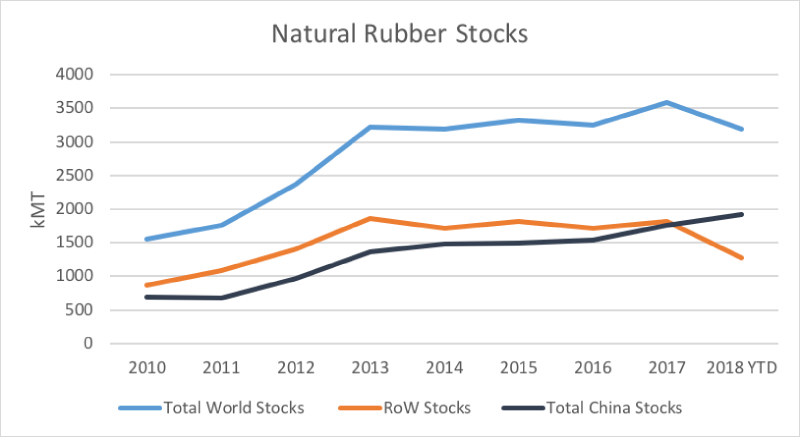
Arriving at the Rest of World stocks by subtracting the above China numbers from the IRSG total world stocks shows China’s share of global stocks has been increasing steadily since 2011, accounting for 60% of the world’s total.
Table 3: Global Stock Summary (kMT)
| Global Stock Summary (kMT) | ||||
| 年份 | Total World Stocks | Total China Stocks | RoW Stocks | China Share of Stocks |
| 2010 | 1558 | 692 | 866 | 44% |
| 2011 | 1763 | 673 | 1090 | 38% |
| 2012 | 2375 | 966 | 1409 | 41% |
| 2013 | 3227 | 1363 | 1864 | 42% |
| 2014 | 3188 | 1479 | 1709 | 46% |
| 2015 | 3319 | 1501 | 1818 | 45% |
| 2016 | 3252 | 1538 | 1714 | 47% |
| 2017 | 3589 | 1767 | 1822 | 49% |
| 2018 YTD | 3194 | 1914 | 1280 | 60% |
Figure 8: Natural Rubber Stocks
Stocks-to-use Analysis – 中国
Undoubtedly, China’s total stocks appear burdensome and as figure 9 shows stocks-to-use have been steadily increasing since 2010 to 35% of one year’s use.
However, when excluding SHFE and SRB stocks, the situation is very different and shows a dramatically tighter rubber market in China. In fact, freely available or tradable stocks-to-use have been in decline since 2013.
Figure 9: China Stocks-to-use Ratio
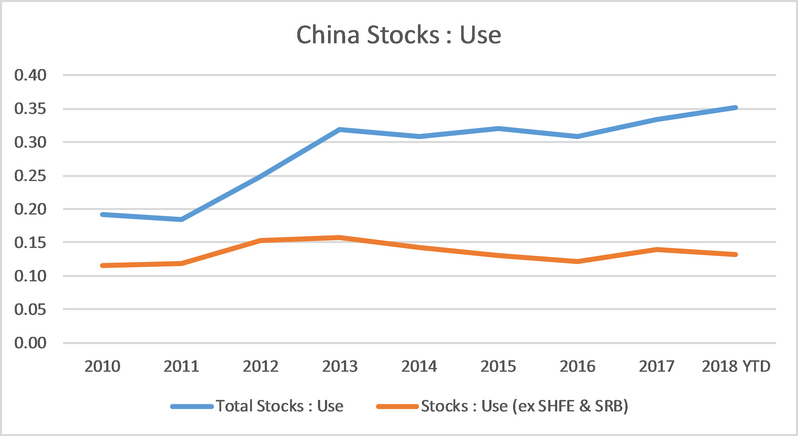
Table 4: China Stocks Use Summary
| China Stocks : Use Summary | |||
| 年份 | China Consumption | Total Stocks : Use | Stocks : Use (ex SHFE & SRB) |
| 2010 | 3622 | 0.19 | 0.12 |
| 2011 | 3638 | 0.19 | 0.12 |
| 2012 | 3890 | 0.25 | 0.15 |
| 2013 | 4270 | 0.32 | 0.16 |
| 2014 | 4804 | 0.31 | 0.14 |
| 2015 | 4680 | 0.32 | 0.13 |
| 2016 | 4982 | 0.31 | 0.12 |
| 2017 | 5301 | 0.33 | 0.14 |
| 2018 YTD | 2717 | 0.35 | 0.13 |
Further analysis – Rest of World
When looking at the Rest of World excluding China, the market is beginning to tighten in 2018 after peaking in 2013.
Figure 10: Rest of World Stocks-to-use Ratio
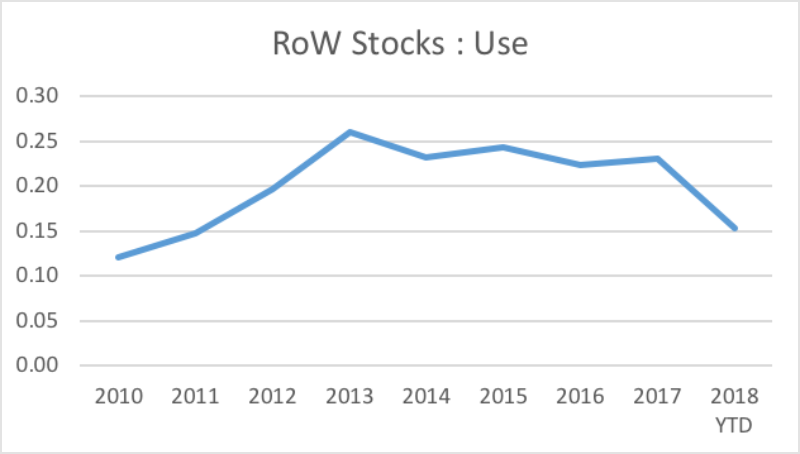
Table 5: Rest of World Stocks Use Summary (ex-China) 
| Rest of World Stocks : Use Summary (ex China) | |||
| 年份 | RoW Stocks | RoW Consumption | RoW Stocks : Use |
| 2010 | 866 | 7137 | 0.12 |
| 2011 | 1090 | 7396 | 0.15 |
| 2012 | 1409 | 7156 | 0.20 |
| 2013 | 1864 | 7160 | 0.26 |
| 2014 | 1709 | 7377 | 0.23 |
| 2015 | 1818 | 7454 | 0.24 |
| 2016 | 1714 | 7688 | 0.22 |
| 2017 | 1822 | 7921 | 0.23 |
| 2018 YTD | 1280 | 4187 | 0.15 |
Conclusion
Excluding SHFE stocks, which are at a record high, and also SRB reserve stocks which are not freely tradable, the global natural rubber market looks much tighter than what the headline numbers suggest. In fact, Rest of World’s stocks-to-use levels in 2018 are close to the same levels not seen since 2011 when prices were at a record.
Figure 11: World Stocks-to-use Ratio (ex SRB and SHFE Stocks)
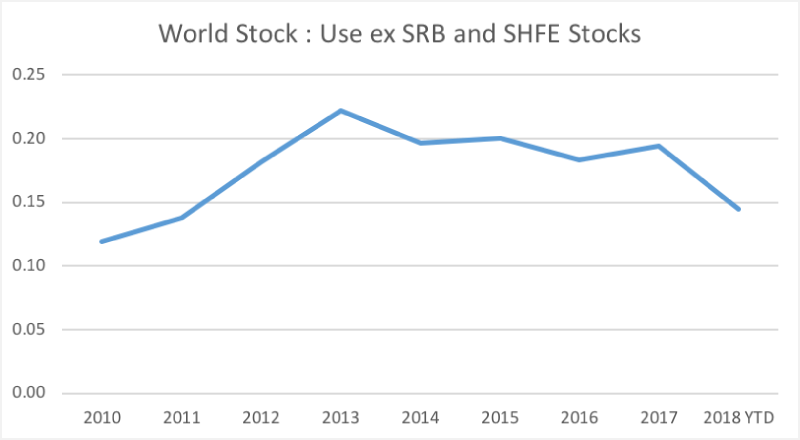
The scatter plot shown in figure 12 denotes this clearly, where the blue point is 2018’s current price (below 140USC) relative to stocks-to-use. If this was to be more closely aligned to the trend, then FOB TSR20 prices should be closer to 250USC/kg.
Figure 12: World Stocks-to-use Ratio (ex SHFE and SRB) vs Price
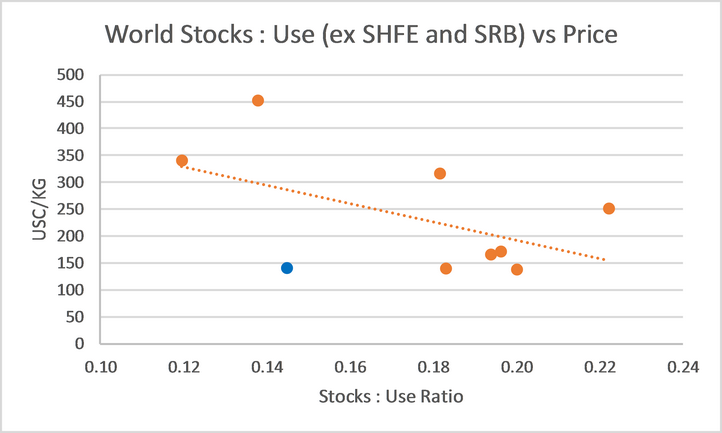
The analysis also highlights the burdensome situation and distortion SHFE is creating with such large carries and expansion of deliverable stocks. If the RoW situation remains on its current tightening trajectory, SHFE WF values should significantly underperform FOB TSR20 values.
Glossary of Rubber Terms:
FOB: Free on Board
NR: Natural Rubber
RSS: Ribbed Smoked Sheet
SCR : Standard China Rubber
SR: Synthetic Rubber
SRB: State Reserve Bureau
TSR20: Technically Specify Rubber Grade
WF: Whole Field
Stocks-to-use ratio is calculated by dividing total stocks by total use (or consumption). It is a better measure of market tightness as it expresses available stocks as a percentage of total use (consumption).


